


Architecture
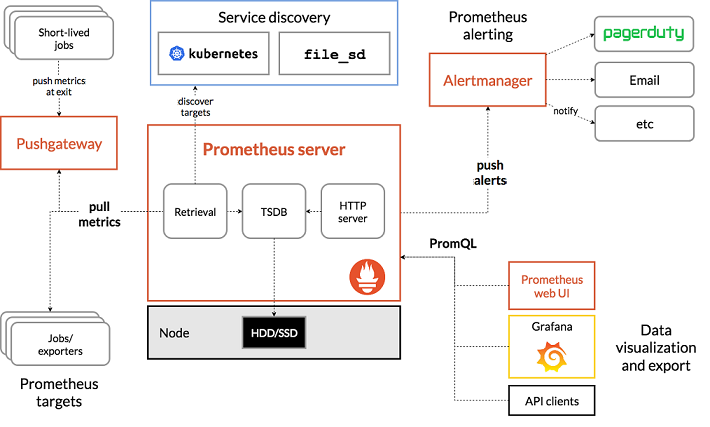
There are five steps to use Prometheus with Grafana:
- ● Preparing your Environment
- ● Download and Install Node Exporter
- ● Download and Install Prometheus
- ● Configuring Prometheus
- ● Download and Install Grafana
Preparing your Environment
1. To run Prometheus safely on our server, we have to create a user for Prometheus and Node Exporter without the possibility to log in. To achieve this, we use the parameter --no-create-home which skips the creation of a home directory and disable the shell with --shell /usr/sbin/nologin.sudo useradd --no-create-home --shell /usr/sbin/nologin prometheus
sudo useradd --no-create-home --shell /bin/false node_exporter2. Create the folders required to store the binaries of Prometheus and its configuration files:
sudo mkdir /etc/prometheus
sudo mkdir /var/lib/prometheus
Set the ownership of these directories to our prometheus user, to make sure that Prometheus can access to these folders:
sudo chown prometheus:prometheus /etc/prometheus
sudo chown prometheus:prometheus /var/lib/prometheus
Set the ownership of these directories to our prometheus user, to make sure that Prometheus can access to these folders:
sudo chown prometheus:prometheus /etc/prometheus
sudo chown prometheus:prometheus /var/lib/prometheus
Download and Install Node Exporter
As your Prometheus is only capable of collecting metrics, we want to extend its capabilities by adding Node Exporter, a tool that collects information about the system including CPU, disk, and memory usage and exposes them for scraping.
1. Download the latest version of Node Exporter:
wget https://github.com/prometheus/node_exporter/releases/download/v0.16.0/node_exporter-0.16.0.linux-amd64.tar.gz2. Unpack the downloaded archive. This will create a directory node_exporter-0.16.0.linux-amd64, containing the executable, a readme and license file:
tar xvf node_exporter-0.16.0.linux-amd64.tar.gz3. Copy the binary file into the directory /usr/local/bin and set the ownership to the user you have created in step previously:
sudo cp node_exporter-0.16.0.linux-amd64/node_exporter /usr/local/bin
sudo chown node_exporter:node_exporter /usr/local/bin/node_exporter
4. Remove the leftover files of Node Exporter, as they are not needed any longer:
sudo rm -rf node_exporter-0.16.0.linux-amd64.tar.gz node_exporter-0.16.0.linux-amd645. To run Node Exporter automatically on each boot, a Systemd service file is required. Create the following file by opening it in Nano:
sudo nano /etc/systemd/system/node_exporter.service6. Copy the following information in the service file, save it and exit Nano:
[Unit]
Description=Node Exporter
Wants=network-online.target
After=network-online.target

[Service]
User=node_exporter
Group=node_exporter
Type=simple
ExecStart=/usr/local/bin/node_exporter

[Install]
WantedBy=multi-user.target
7. Collectors are used to gather information about the system. By default a set of collectors is activated. You can see the details about the set in the README-file. If you want to use a specific set of collectors, you can define them in the ExecStart section of the service. Collectors are enabled by providing a--collector.
8. Reload Systemd to use the newly defined service:
sudo systemctl daemon-reload9. Run Node Exporter by typing the following command:
sudo systemctl start node_exporter10. Verify that the software has been started successfully:
sudo systemctl status node_exporterYou will see an output like this, showing you the status active (running) as well as the main PID of the application:
● node_exporter.service - Node Exporter
   Loaded: loaded (/etc/systemd/system/node_exporter.service; disabled; vendor preset: enabled)
   Active: active (running) since Mon 2018-06-25 11:47:06 UTC; 4s ago
 Main PID: 1719 (node_exporter)
   CGroup: /system.slice/node_exporter.service
           └─1719 /usr/local/bin/node_exporter
11. If everything is working, enable Node Exporter to be started on each boot of the server:
sudo systemctl enable node_exporterDownload and Install Prometheus
1. Download and Unpack Prometheus latest release of Prometheus. As exemplified, the version is 2.2.1:
sudo apt-get update && apt-get upgrade
wget https://github.com/prometheus/prometheus/releases/download/v2.2.1/prometheus-2.2.1.linux-amd64.tar.gz
tar xfz prometheus-*.tar.gz
cd prometheus-*
The following two binaries are in the directory:
- ● Prometheus - Prometheus main binary file
- ● promtool
The following two folders (which contain the web interface, configuration files examples and the license) are in the directory:
- ● consoles
- ● console_libraries
2. Copy the binary files into the /usr/local/bin/directory:
sudo cp ./prometheus /usr/local/bin/
sudo cp ./promtool /usr/local/bin/
3. Set the ownership of these files to the prometheus user previously created:
sudo chown prometheus:prometheus /usr/local/bin/prometheus
sudo chown prometheus:prometheus /usr/local/bin/promtool
4. Copy the consoles and console_libraries directories to /etc/prometheus:
sudo cp -r ./consoles /etc/prometheus
sudo cp -r ./console_libraries /etc/prometheus
5. Set the ownership of the two folders, as well as of all files that they contain, to our prometheus user:
sudo chown -R prometheus:prometheus /etc/prometheus/consoles
sudo chown -R prometheus:prometheus /etc/prometheus/console_libraries
6. In our home folder, remove the source files that are not needed anymore:
cd .. && rm -rf prometheus-*Configuring Prometheus
1. Prior to using Prometheus, it needs basic configuring. Thus, we need to create a configuration file named prometheus.yml
sudo nano /etc/prometheus/prometheus.ymlPrometheus configuration file is divided into three parts: global, rule_files, and scrape_configs. In the global part we can find the general configuration of Prometheus: scrape_interval defines how often Prometheus scrapes targets, evaluation_interval controls how often the software will evaluate rules. Rules are used to create new time series and for the generation of alerts. The rule_files block contains information of the location of any rules we want the Prometheus server to load. The last block of the configuration file is named scape_configs and contains the information which resources Prometheus monitors. Our file should look like this example:
global:
  scrape_interval:     15s
  evaluation_interval: 15s

rule_files:
  # - "first.rules"
  # - "second.rules"

scrape_configs:
  - job_name: 'prometheus'
    scrape_interval: 5s
    static_configs:
      - targets: ['localhost:9090']
The global scrape_interval is set to 15 seconds which is enough for most use cases. We do not have any rule_files yet, so the lines are commented out and start with a #. In the scrape_configs part we have defined our first exporter. It is Prometheus that monitors itself. As we want to have more precise information about the state of our Prometheus server we reduced the scrape_interval to 5 seconds for this job. The parameters static_configsand targets determine where the exporters are running. In our case it is the same server, so we use localhost and the port 9090. As Prometheus scrapes only exporters that are defined in the scrape_configs part of the configuration file, we have to add Node Exporter to the file, as we did for Prometheus itself. We add the following part below the configuration for scrapping Prometheus:
- job_name: 'node_exporter'
  scrape_interval: 5s
  static_configs:
    - targets: ['localhost:9100']
Overwrite the global scrape interval again and set it to 5 seconds. As we are scarping the data from the same server as Prometheus is running on, we can use localhost with the default port of Node Exporter: 9100. If you want to scrape data from a remote host, you have to replace localhost with the IP address of the remote server. For all information about the configuration of Prometheus, you may check the configuration documentation.
2. Set the ownership of the file to our Prometheus user:
sudo chown prometheus:prometheus /etc/prometheus/prometheus.ymlOur Prometheus server is ready to run for the first time.
Running Prometheus
1. Start Prometheus directly from the command line with the following command, which executes the binary file as our Prometheus user:
sudo -u prometheus /usr/local/bin/prometheus --config.file /etc/prometheus/prometheus.yml --storage.tsdb.path /var/lib/prometheus/ --web.console.templates=/etc/prometheus/consoles --web.console.libraries=/etc/prometheus/console_librariesThe server starts displaying multiple status messages and the information that the server has started:
level=info ts=2018-04-12T11:56:53.084000977Z caller=main.go:220 msg="Starting Prometheus" version="(version=2.2.1, branch=HEAD, revision=bc6058c81272a8d938c05e75607371284236aadc)"
level=info ts=2018-04-12T11:56:53.084463975Z caller=main.go:221 build_context="(go=go1.10, user=root@149e5b3f0829, date=20180314-14:15:45)"
level=info ts=2018-04-12T11:56:53.084632256Z caller=main.go:222 host_details="(Linux 4.4.127-mainline-rev1 #1 SMP Sun Apr 8 10:38:32 UTC 2018 x86_64 scw-041406 (none))"
level=info ts=2018-04-12T11:56:53.084797692Z caller=main.go:223 fd_limits="(soft=1024, hard=65536)"
level=info ts=2018-04-12T11:56:53.09190775Z caller=web.go:382 component=web msg="Start listening for connections" address=0.0.0.0:9090
level=info ts=2018-04-12T11:56:53.091908126Z caller=main.go:504 msg="Starting TSDB ..."
level=info ts=2018-04-12T11:56:53.102833743Z caller=main.go:514 msg="TSDB started"
level=info ts=2018-04-12T11:56:53.103343144Z caller=main.go:588 msg="Loading configuration file" filename=/etc/prometheus/prometheus.yml
level=info ts=2018-04-12T11:56:53.104047346Z caller=main.go:491 msg="Server is ready to receive web requests."
2. Open your browser and type http://IP.OF.YOUR.SERVER:9090 to access the Prometheus interface. If everything is working, we end the task by pressing on CTRL + C on our keyboard.
3. The server is working now, but it cannot yet be launched automatically at boot. To achieve this, we have to create a new systemd configuration file that will tell your OS which services should it launch automatically during the boot process.
sudo nano /etc/systemd/system/prometheus.serviceThe service file tells systemd to run Prometheus as prometheus and specifies the path of the configuration files.
4. Copy the following information in the file and save it, then exit the editor:
[Unit]
  Description=Prometheus Monitoring
  Wants=network-online.target
  After=network-online.target

[Service]
  User=prometheus
  Group=prometheus
  Type=simple
  ExecStart=/usr/local/bin/prometheus \
  --config.file /etc/prometheus/prometheus.yml \
  --storage.tsdb.path /var/lib/prometheus/ \
  --web.console.templates=/etc/prometheus/consoles \
  --web.console.libraries=/etc/prometheus/console_libraries
  ExecReload=/bin/kill -HUP $MAINPID

[Install]
  WantedBy=multi-user.target
5. To use the new service, reload systemd:
sudo systemctl daemon-reloadWe enable the service so that it will be loaded automatically during boot:
sudo systemctl enable prometheus6. Start Prometheus:
sudo systemctl start prometheusYour Prometheus server is ready to be used. We have now installed Prometheus to monitor your instance.
Prometheus Web Interface
Prometheus provides a basic web server running on http://your.server.ip:9000 that provide access to the data collected by the software. We can verify the status of our Prometheus server from the interface:
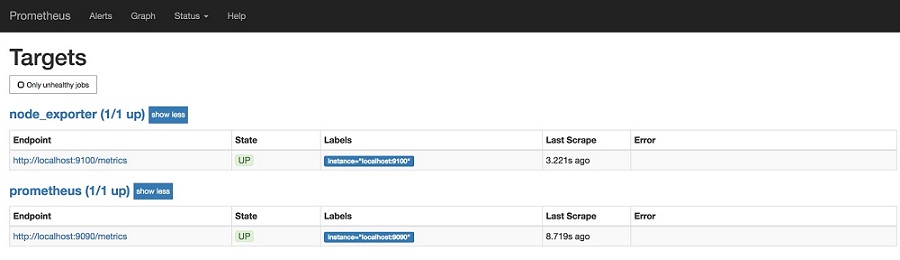
Moreover, do some queries in the data that has been collected.
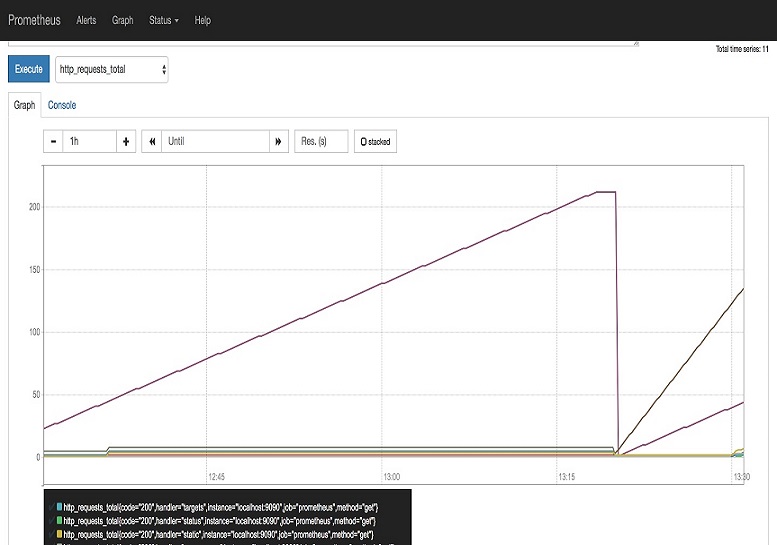
The interface is very lightweight, and the Prometheus team recommend to use a tool like Grafana if you want to do more than testing and debugging the installation.
Installing Grafana
1. Install Grafana on our instance which queries our Prometheus server.
wget https://s3-us-west-2.amazonaws.com/grafana-releases/release/grafana_5.0.4_amd64.deb
sudo apt-get install -y adduser libfontconfig
sudo dpkg -i grafana_5.0.4_amd64.deb
2. Enable the automatic start of Grafana by systemd:
sudo systemctl daemon-reload && sudo systemctl enable grafana-server && sudo systemctl start grafana-serverGrafana is running now, and we can connect to it at http://your.server.ip:3000. The default user and password is admin / admin.
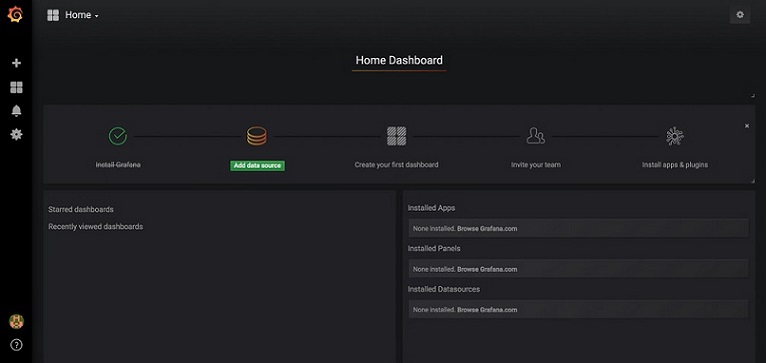
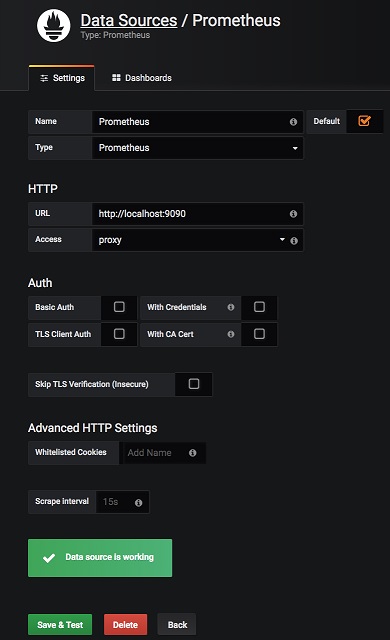
Now you have to create a Prometheus data source:
- ● Click on the Grafana logo to open the sidebar.
- ● Click on “Data Sources” in the sidebar.
- ● Choose “Add New”.
- ● Select “Prometheus” as the data source.
- ● Set the Prometheus server URL (in our case: http://localhost:9090/)
- ● Click “Add” to test the connection and to save the new data source.
Your settings should look like this:
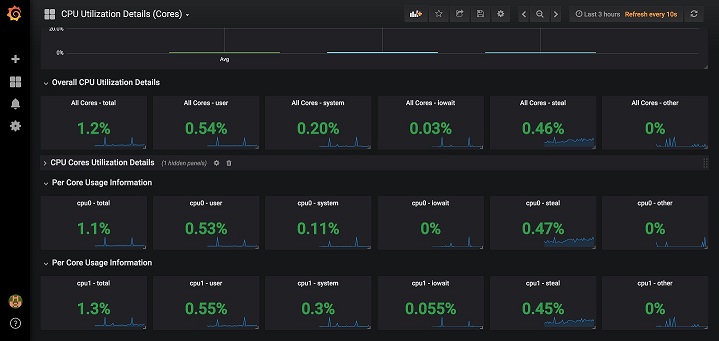
You are now ready to create your first dashboard from the information collected by Prometheus. You can also import some dashboards from a collection of shared dashboards Here is an example of a Dashboard that uses the CPU usage of our node and presents it in Grafana:
In this tutorial, we were able to configure a Prometheus server with two data collectors that are scraped by our Prometheus server which provides the data to build Dashboards with Grafana. Don’t hesitate to consult the official documentation of Prometheus and Grafana.
Source: https://www.scaleway.com/en/docs/configure-prometheus-monitoring-with-grafana/